
 Canada (EN)
  Germany (DE)
  France (FR)
  Italy (IT)
  Netherlands (NL)
  New Zealand (EN)
  United Kingdom (EN)
 Holiday Survey: How Americans Budget, Shop, and Cope During This Season


The holiday season isn’t just about joy—it’s a multi-billion-dollar tradition that shapes how Americans celebrate and connect. From exchanging gifts to festive gatherings, the spirit of giving fuels both happiness and the economy.
But how are shoppers adapting their habits in 2024? Our survey of over 3,000 American adults reveals key trends in holiday budgets, shopping strategies, and stress points.
How America Will Spend For The Holidays
Let’s start with the big picture. The national results reveal a great deal about Americans’ overall attitudes toward gifting their loved ones, providing some surprising and thought-provoking insights.
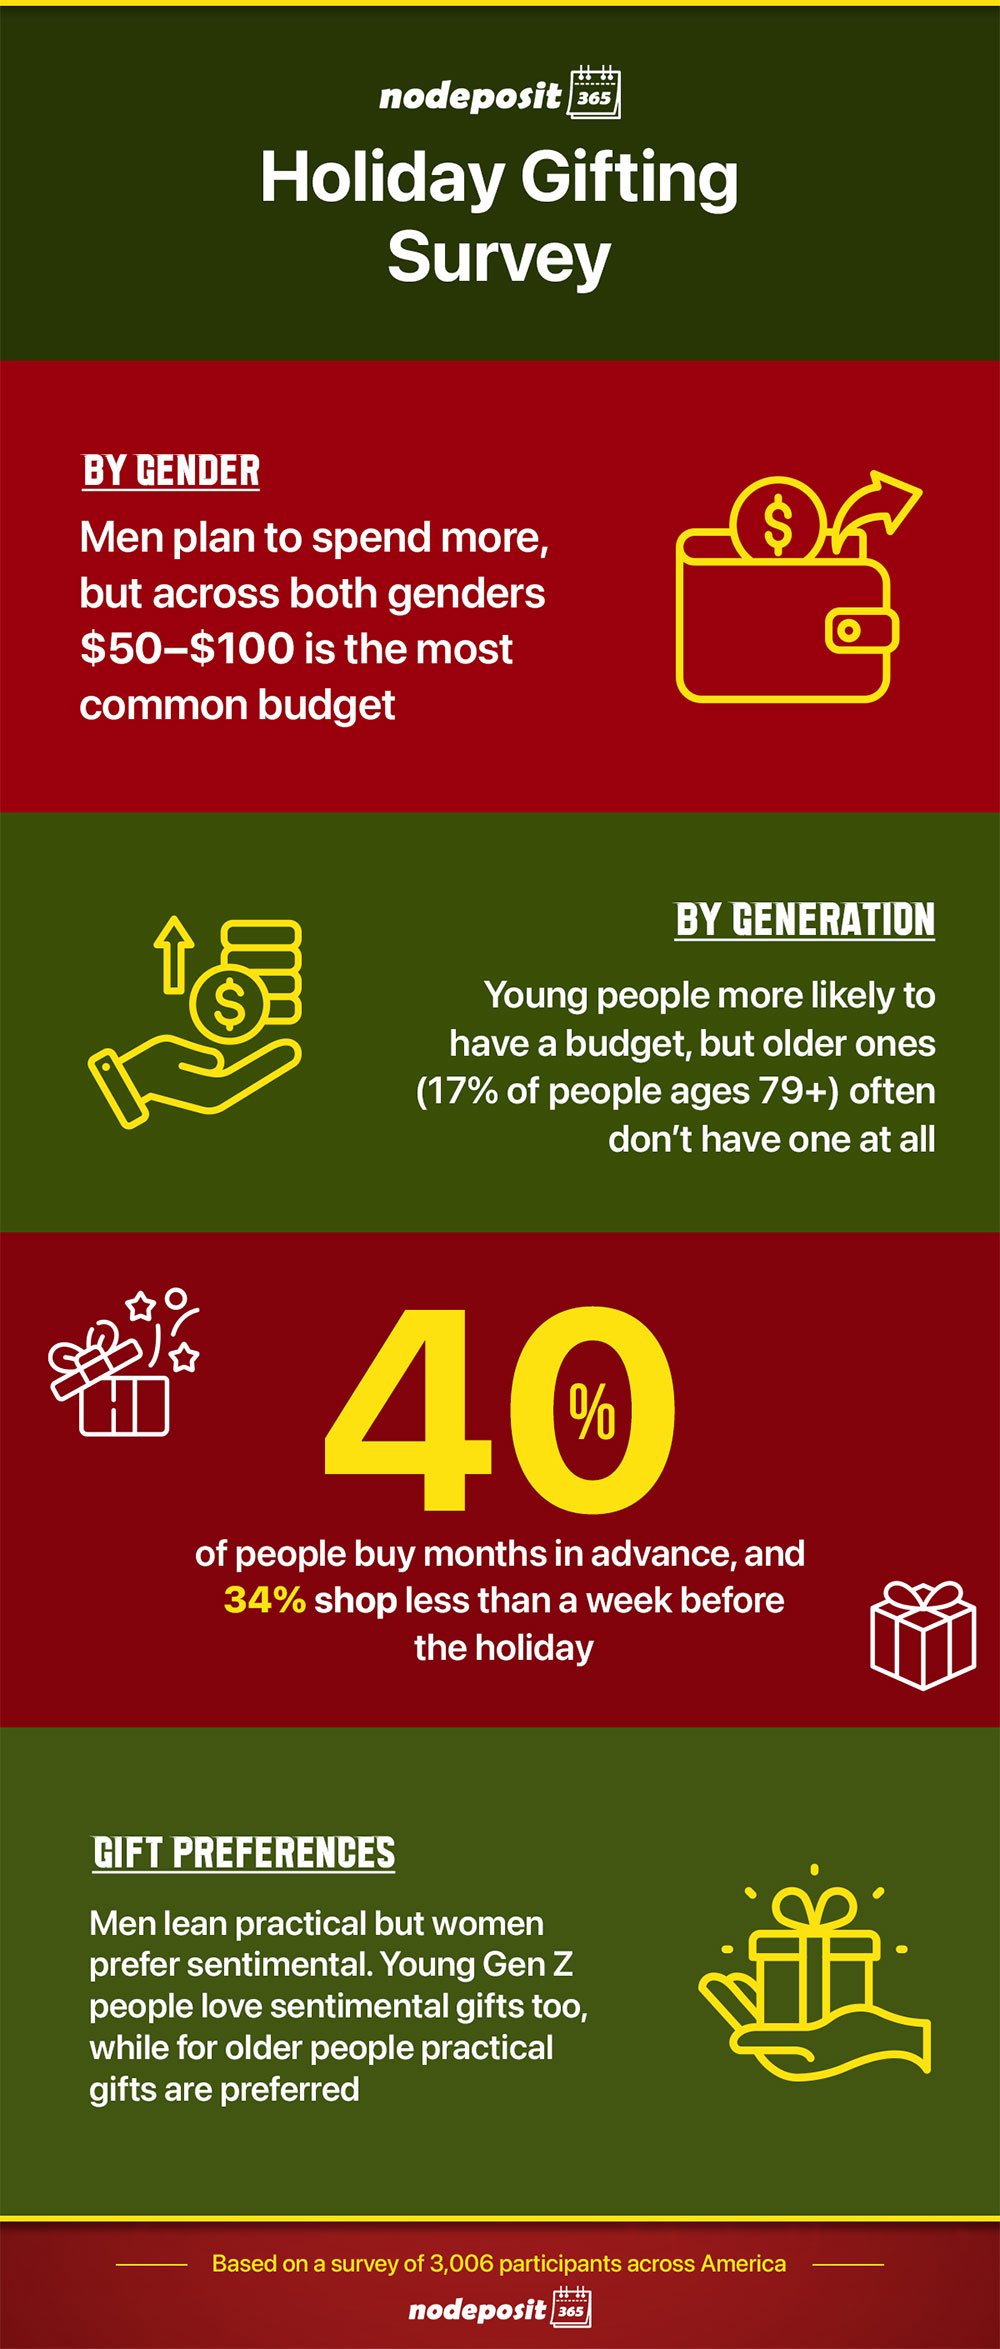
- Gender gift gap: Men plan to spend more, but across both genders $50–$100 is the most common budget. Men also want practical gifts but women prefer sentimental.
- Gift planning: 40% of people buy months in advance, and 34% shop less than a week before the holiday.
- Gen Z is budget-conscious: Young people are more likely to have a budget, but older ones (17% of people ages 79+) often don’t have one at all
- Generational differences: Young Gen Z people love sentimental gifts too, while for older people practical gifts are preferred.
Holiday gifting in 2024 reflects a mix of optimism and caution. Americans are adapting to a shifting economy by budgeting more carefully, with 40% adjusting their habits this year to spend either more or less than 2023
The Holiday Budget Breakdown
Americans aren’t skimping on their holiday spending, but they’re also keeping an eye on their wallets.
Nationally, the average holiday gift budget is $433.85.
Men tend to splurge more than women, with 63% of men expecting to spend $200+, compared to just 49% of women.
Older generations? They’re either spending less or skipping a formal budget altogether—17% of those aged 79+ report no set budget.
On the flip side, 19% of Gen Z (16–27) are putting aside $50–$100 for gifts, showing that younger folks are taking budgeting seriously.
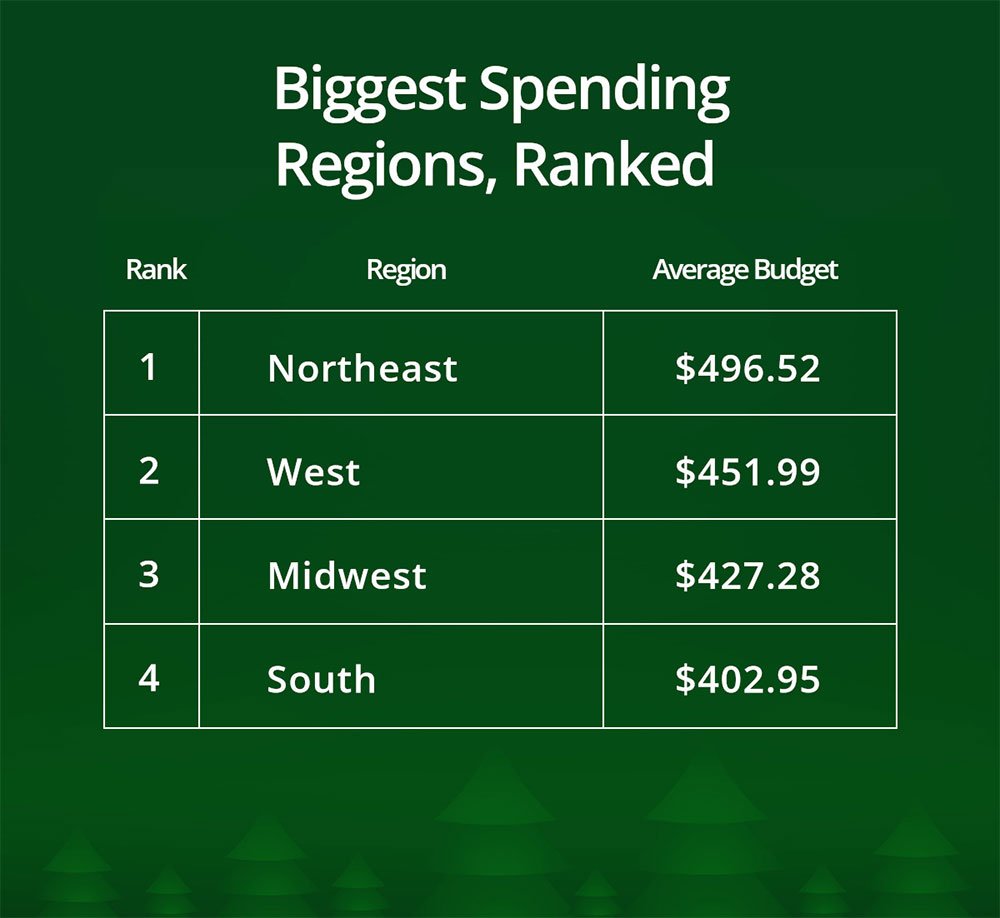
Biggest Spending Region: The Northeastern States lead, spending an average of $496.52 on high-end gifts over the holidays
| Rank | Region | Average Budget |
|---|---|---|
| 1 | Northeast | $496.52 |
| 2 | West | $451.99 |
| 3 | Midwest | $427.28 |
| 4 | South | $402.95 |
Most Frugal Region: The Southern States, with an average of $402.95
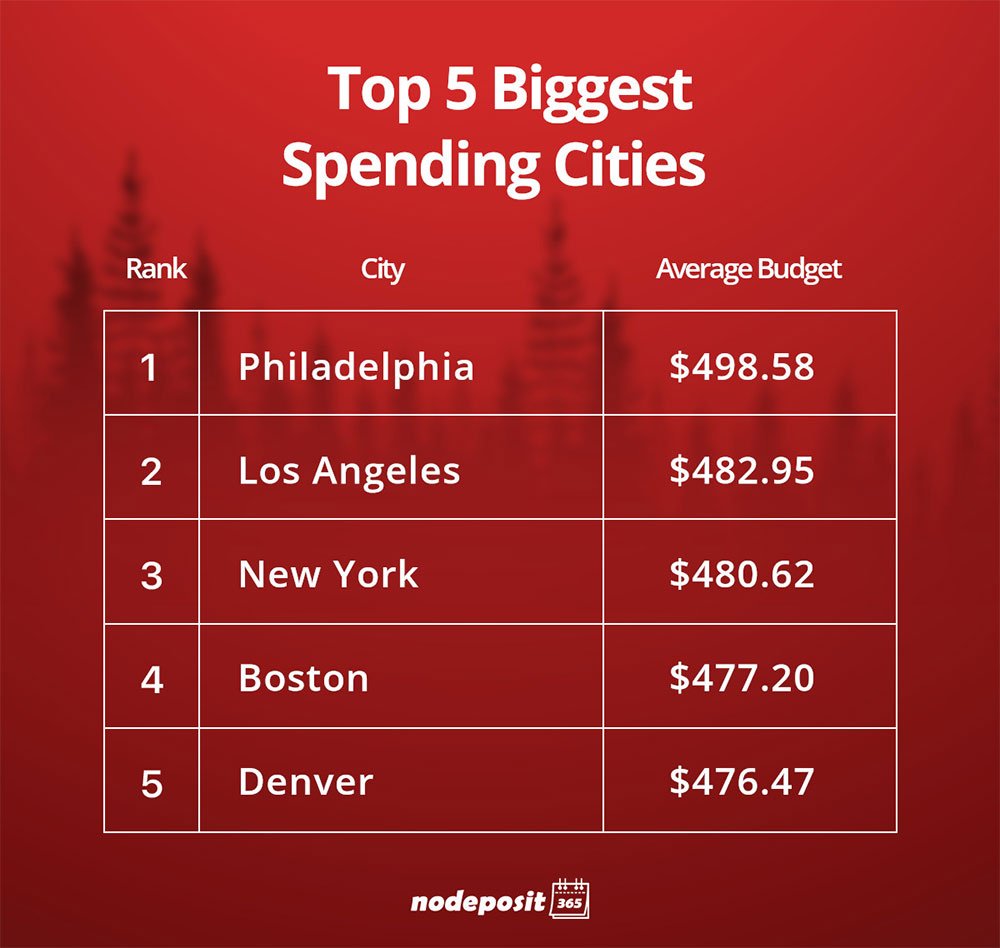
Biggest Spending City: Philadelphia, with residents splashing out an average of $498.58
| Rank | City | Average Budget |
|---|---|---|
| 1 | Philadelphia | $498.58 |
| 2 | Los Angeles | $482.95 |
| 3 | New York | $480.62 |
| 4 | Boston | $477.20 |
| 5 | Denver | $476.47 |
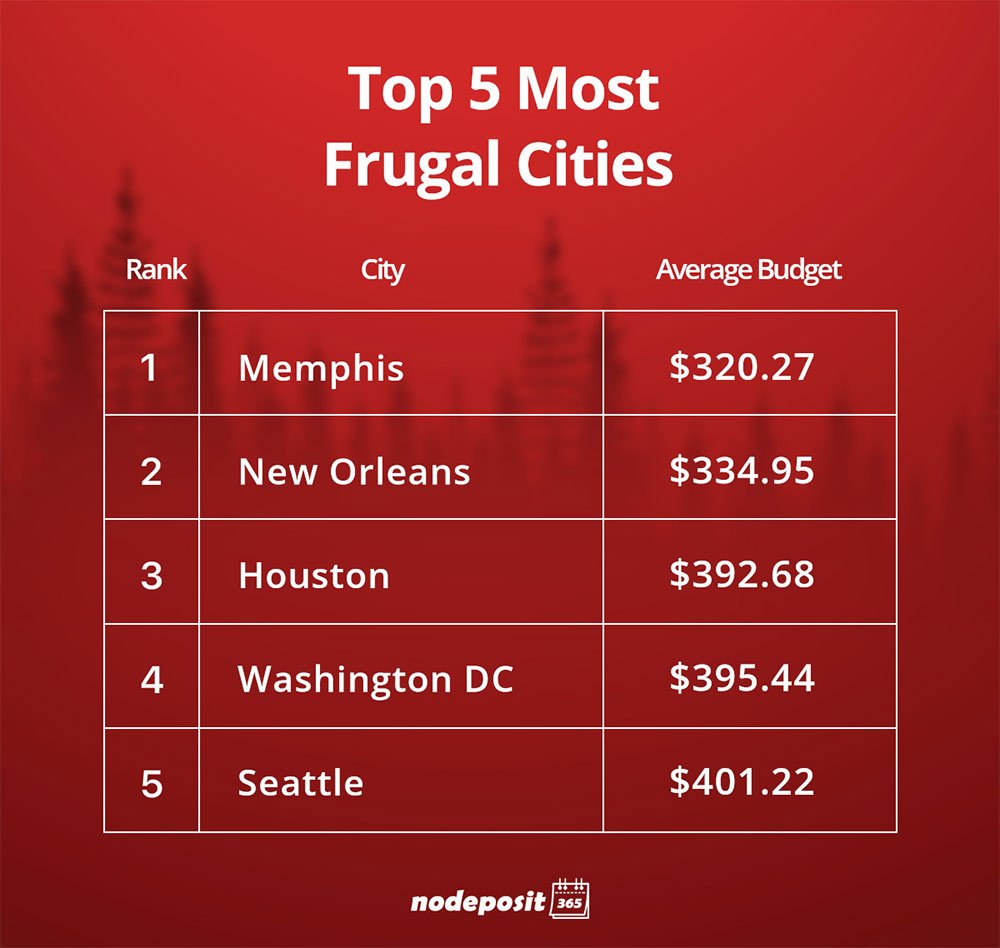
Most Frugal City: Memphis, with an average budget of just $320.27
| Rank | City | Average Budget |
|---|---|---|
| 1 | Memphis | $320.27 |
| 2 | New Orleans | $334.95 |
| 3 | Houston | $392.68 |
| 4 | Washington DC | $395.44 |
| 5 | Seattle | $401.22 |
When Do Americans Start Shopping?
Most of us like to shop in advance, but how far in advance varies.
- For 40% of Americans, holiday prep begins months in advance.
- A total of 34% admit they wait until the last week before the holidays.
- The remainder shop throughout the year (14%), while 11% don’t follow a specific timeline at all.
- Earliest Shoppers: South Dakotans are ahead of the game, with 66% starting their shopping months before
- Procrastinators: Vermonters procrastinate the most—60% wait until the week before.
Generational differences shine through here. Gen Z and millennials are early birds, often starting in October or even earlier. Meanwhile, folks aged 79+ take a more laid-back approach, with many opting for sporadic shopping.
Holiday Shopping Styles
Americans fall into three main categories: planners, deal hunters, and impulse buyers.
- Planners: 28% of Americans stick to a strict shopping list.
- Deal Hunters: 52% of Americans create a rough list and hunt for bargains.
- Impulse Buyers: 12% of Americans wing it, snagging whatever catches their eye.
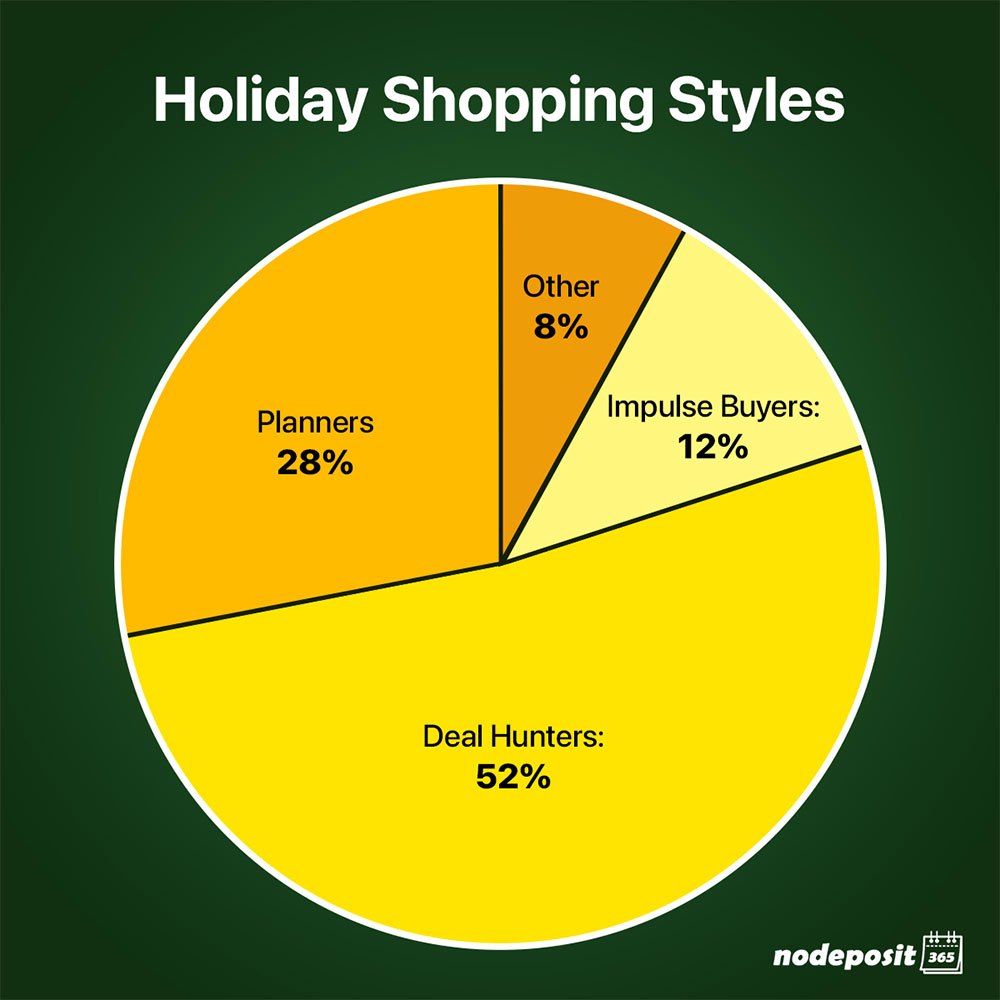
Interestingly, Gen Z and older generations (79+) are more likely to plan ahead, though younger shoppers lean toward rough outlines rather than rigid lists.
- Biggest Impulse Buyers: Seattlites are money savvy, 63% are all about bargain hunting and impulse buys.
- Biggest Planners: In lively New Orleans, around 44% plan their list meticulously and stick to it.
What Americans Want Most Under the Tree
When it comes to gifts, tastes vary widely. Men love practical items, while women lean toward sentimental choices. Younger generations adore personalized, sentimental gifts, while older Americans favor functional presents.
By Gender
- Men prefer practical gifts over sentimental gifts, with 39% preferring these compared to just 20% for sentimental gifts.
- While Women also prefer practical items, there is a stronger preference for sentimental gifts, with 28% of Women preferring sentimental gifts during the holiday season.
By Generation
- Preference for sentimental items drops among older generations, with 33% of Gen Z preferring sentimentality, compared to just 17% among Baby Boomers and 8% for the Silent Generation.
- Likewise, 47% of Baby Boomers said they want practical items, compared to 25% of Gen Z.
The Northeast is at the top for luxury gifts and experiences, with 10% desiring luxury items during the holiday season and another 10% preferring gifts of unique experiences and holidays over anything else. Westerners most want practical, useful items, with 27% preferring these. Southerners most prefer sentimental gifts, with 27% preferring heartfelt gifts.
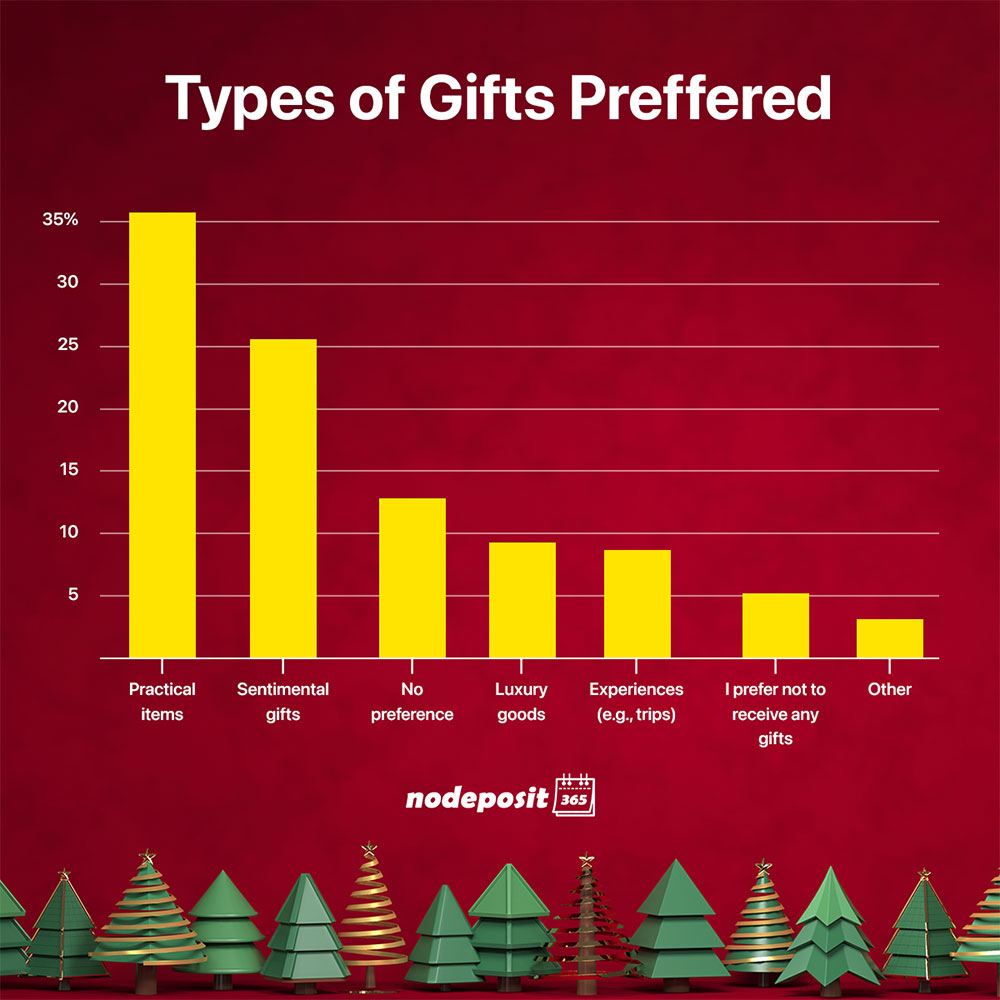
- Most Practical City: San Antonio tops the charts, with 47% preferring useful items
- Most Sentimental City: Residents of Denver. are more into thoughtful, sentimental gifts
What’s the Most Stressful Part of the Holidays?
It’s not all cheer and good vibes—holiday stress is real. For most Americans, finances are the biggest worry, followed by the pressure of finding the perfect gift and juggling time constraints.
- Biggest stressor: For most people (35%) the most stressful thing is staying on budget.
- Second biggest stressor: For most people is dealing with holiday crowds (29%).
- Gen X, Millennial and Gen Z most stressed: After staying on budget, their major stressor is about finding the perfect gift.
- Baby Boomers and older: report less stress overall.
Many people had common concerns and stresses.
- Most Stressed City: While the data was close, Denver is the most stressed overall.
- Least Stressed City: Chicago is the least stressed across America.
Fair Use
Feel free to reference or share this content. Please credit us with a link back to this page.
